Bar Charts
Bar Charts is a simple way to visualize grouped data through colorful
rectangles. In the world of text buffers and shell output, it is
surprising that Emacs has a library to draw colored rectangles:
chart.
(require 'chart)

(chart-bar-quickie
 'vertical "Favorite Type of Movie"                        ;; Type & Title
 '("Comedy" "Action" "Romance" "Drama" "Sci-Fi") "Genre"   ;; Keys & Label
 '(4 5 6 1 4) "People"                                     ;; Values &  Label
 )
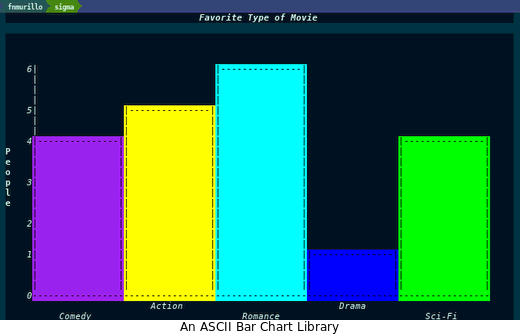
As the screenshot shows above, it is not sophisticated enough to
warrant deep examination but still impressive within the realm of text
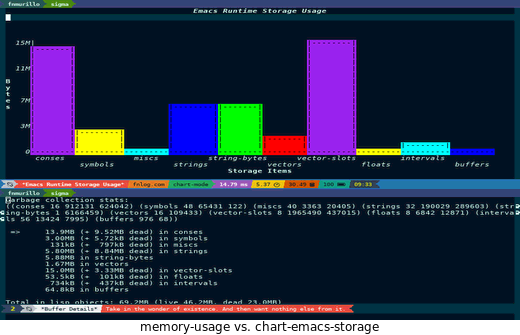
buffers. The context of being builtin leads to fascinating queries
about the Emacs interpreter such as memory-usage.
If you want to try it out, you can use the command load-library to
import chart. It defines the following demo command for exploration:
chart-emacs-storage- This charts the output of
memory-usage chart-emacs-lists- Like
chart-emacs-storage, this counts buffers, frames, processes, faces and x-display within the Emacs session chart-rmail-from- With
rmail, it groups user sender occurrences by mail chart-space-usage- After selecting a directory, it shows the disk usage by file type within said directory
chart-file-count- After selecting a directory, it displays file type occurrences within the directory
chart-test-it-all- A chart testing positive and negative values
Aside from those demo commands, how can we use it and make a chart?
Making A Chart
After some reading and exploration, the starting command or function
to understand this library is chart-bar-quickie, the rest seem
internal. Although this function has a total of eight arguments which
two are optional, it encapsulates everything needed to make the chart
including labels and data rather than instantiating classes and
objects. A small snippet to elaborate:
(defun fn/chart-comparator-< (left right)
  "A sample comparator for the values.
Each parameter is a key-value cos pair and should function as a
comparator like `<', `=', or `>'."
  (pcase-let ((`(,left-key . ,left-value) left)    ;; left is a cons of key and value
              (`(,right-key . ,right-value) right) ;; ditto with right
              )
    (< left-value right-value)))

(chart-bar-quickie
 'vertical                           ;; Chart direction, either 'vertical or 'horizontal
 "Chart Title"                       ;; Chart title
 '("Alpha" "Beta" "Gamma" "Delta")   ;; X-Axis values or keys
 "X Line"                            ;; X-Axis label
 '(4 3 2 1)                          ;; Y-Axis values
 "Y Line"                            ;; Y-Axis label
 ;; Optional
 3                                   ;; Max value allowed, anything higher is not shown
 #'fn/chart-comparator-<             ;; Sorting or ordering function
 )
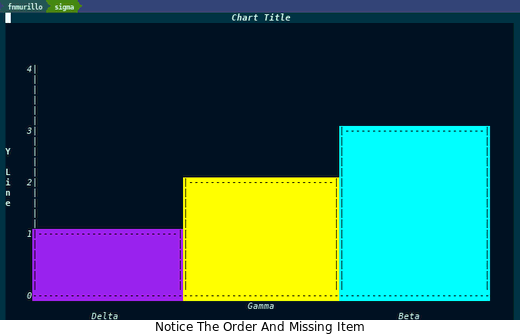
Once evaluated, this creates a new buffer based on the title and
renders the bar chart there. The display itself is inert unlike
tabulated-list-mode or any special buffer modes, so do not expect
special key bindings or commands that sort, zoom, refresh the chart
out of the box. Aside from tempering expectations, all the major (if
not all) functionality is within that function. (Sadly, looking any
deeper does not yield any more insights.) Lastly, the only caveat here
is that the size of the keys and values should be the same which is
natural as it matches each key with the corresponding value.
Demonstration
As an example, let us tackle a statistical query on a dataset. We will play with the Hair Eye Color dataset which looks like this:
"","Hair","Eye","Sex","Freq"
"1","Black","Brown","Male",32
"2","Brown","Brown","Male",53
"3","Red","Brown","Male",10
"4","Blond","Brown","Male",3
"5","Black","Blue","Male",11
Before we query, let us import the data which is a good exercise for CSV parsing in Emacs:
(setq csv-dataset-file (expand-file-name "HairEyeColor.csv" "~/Downloads"))

(defun read-lines (file) ;; Take your pick: custom, find-file, f-read-text
  (with-temp-buffer
    (insert-file-contents-literally file)
    (split-string
     (decode-coding-region (point-min) (point-max) 'utf-8 t)
     "\n"
     t)))

(defun read-csv-field (field) ;; Remove the pesky enclosed double quoting
  (cond
   ((zerop (length field)) "")
   ((and (string-equal (substring-no-properties field 0 1) "\"")
         (string-equal (substring-no-properties field -1) "\""))
    (substring-no-properties field 1 -1))
   (t (string-to-number field))))

(defun read-csv-line (line)
  (let ((raw-fields ;; This assumes no rogue commas need escaping
         (split-string line ",")))
    (mapcar #'read-csv-field raw-fields)))

(defun read-csv-file (file)
  (mapcar #'read-csv-line (read-lines file)))


(setq dataset (read-csv-file csv-dataset-file))

;; Generated output
(("" "Hair" "Eye" "Sex" "Freq")
 ("1" "Black" "Brown" "Male" 32)
 ("2" "Brown" "Brown" "Male" 53)
 ("3" "Red" "Brown" "Male" 10)
 ("4" "Blond" "Brown" "Male" 3))
Libraries exist for this purpose such as csv, el-csv or
parse-csv and utilities like f or parsec but doing it yourself
is an occasional opportunity to review the basics. With that handled,
what can we ask of the data? What is the frequency of eye colors?
Before that, we need to group the data:
(setq headers (car dataset) ;; Only mentioned, not needed
      records (cdr dataset))

(defun group-by (f xs) ;; A quick write on -group-by
  (let ((groups (list)))
    (mapc
     (lambda (x)
       (let* ((key (funcall f x))
              (key-group (assoc key groups)))
         (unless key-group
           (push (cons key (list)) groups)
           (setq key-group (assoc key groups)))
         (setcdr key-group (cons x (cdr key-group)))))
     xs)
    groups))

(defun group-records-by-eye-color (records)
  (let* ((raw-eye-groups (group-by (apply-partially #'nth 2) records))
         (eye-groups (mapcar
                      (lambda (eye-group)
                        (pcase-let ((`(,eye-color . ,eye-records) eye-group))
                          (let ((eye-frequencies ;; Extract frequencies and collect it
                                 (mapcar (apply-partially #'nth 4) eye-records)))
                            (cons eye-color
                                  (apply #'+ eye-frequencies) ;; Shiv for sum
                                  ))))
                      raw-eye-groups)))
    eye-groups))


(setq eye-color-groups (group-records-by-eye-color records))

;; Generated output
(("Green" . 64)
 ("Hazel" . 93)
 ("Blue" . 215)
 ("Brown" . 220))
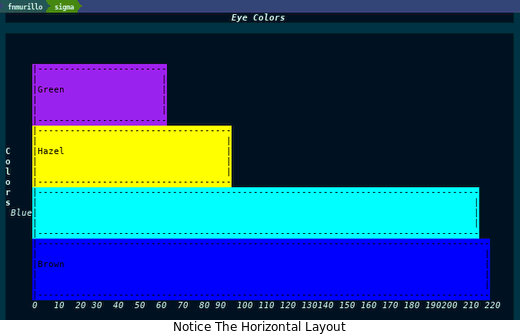
After writing the extraction, getting the bar chart is straightforward.
(chart-bar-quickie
 'horizontal
 "Eye Colors"
 (mapcar #'car eye-color-groups) "Colors"
 (mapcar #'cdr eye-color-groups) "Frequency")
Neat but let's arrange it by descending order:
(defun on (f op) ;; Haskell's on operator
  (lexical-let ((f f)    ;; Sad that parameters aren't lexically scoped here
                (op op))
    (lambda (left right)
      (funcall op (funcall f left) (funcall f right)))))

(chart-bar-quickie
 'horizontal
 "Eye Colors - Descending"
 (mapcar #'car eye-color-groups) "Colors"
 (mapcar #'cdr eye-color-groups) "Frequency"
 nil
 (on #'cdr #'>) ;; A comparator lambda also works but done for variety
 )
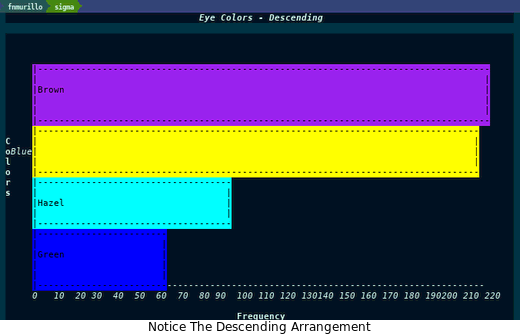
Looking at it, brown and blue eye colors are quite frequent. Nothing groundbreaking or epic. How about applying the same process with hair color? We get the following chart:
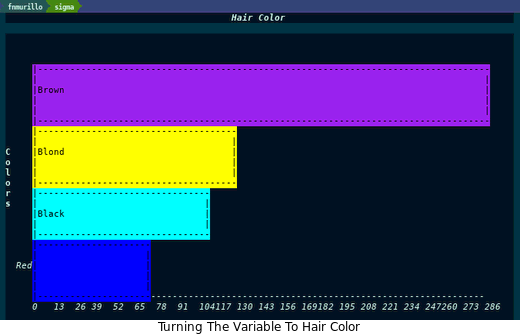
With hair color as the variable, brown and blonds are many. Nothing fancy. We could change the variable into gender but nothing more would be gained. The real question for any visualization is what does it mean? Rather, what insights can we interpret from the data? Since it is a sample, it might not mean anything nor does it have to. This is a library exploration, not a statistical lesson that is beyond scope.
Conclusion
Strangely, that is all there is to it: a neat and easy builtin bar chart library. Since it is not pixel precise, it does not compete with the modern visualizations tools or languages such as Python, R or Haskell although it does not have to. It simply is nice to have and fun to know.
Interestingly, if bar charts can be made with ASCII, how about pies or bubbles. Can Emacs be a modern visualization tool?